Optimization of hydrogen production from glucose by anaerobi
| 论文类型 | 技术与工程 | 发表日期 | 2005-03-01 |
| 作者 | Yang,Mu,Xian-Jun,Zhe | ||
| 摘要 | Yang Mu, Xian-Jun Zheng and Han-Qing Yu* School of Chemistry, The University of Science & Technology of China, Hefei, Anhui, 230026, China *Corresponding author, Fax: +86 551 3601592; E | ||
Yang Mu, Xian-Jun Zheng and Han-Qing Yu*
School of Chemistry, The University of Science & Technology of China, Hefei, Anhui, 230026, China
*Corresponding author, Fax: +86 551 3601592; E-mail: [email protected]
Abstract
In this study, experiments were conducted to investigate the effects of temperature, pH and substrate concentration on microbial H2 production from glucose by using response surface methodology. The optimum conditions for maximum H2 yield of 1.79 mol H2/mol-glucose were found as temperature of 38.8oC, pH 5.7 and glucose concentration of 17.5 g/l. The maximum H2 production rate was estimated as 1412 ml/h at temperature of 42.9oC, pH 5.8 and glucose concentration of 16.0 g/l, respectively. To confirm the validity of the experimental conditions obtained by the response surface analysis, two additional experiments were conducted. In the conformation experiment the maximum H2 yield at temperature of 38.8oC, pH 5.7 and glucose concentration of 8.8 g/l was 1.77 mol H2/mol-glucose, close to 1.79 mol H2/mol-glucose calculated by the model. On the other hand, in the conformation experiment the maximum H2 production rate at temperature of 42.9oC, pH 5.8 and glucose concentration of 16.0 g/l was 1208 ml/h, close to 1412 ml/h estimated by regression analysis.
Keywords: Anaerobic; Hydrogen; Maximization; Response surface methodology (RSM)
Introduction
Hydrogen gas has been considered as a promising candidate to replace methane, which is usually produced through anaerobic digestion of various wastes. Compared with the chemical processes for H2 production, biological H2 production by fermentative process can be operated at ambient temperatures and normal pressures (Yu, et al, 2002). Furthermore, this process can reuse large amount of various waste materials from industries and agriculture. Biological H2 production facilitates both waste materials treatment and energy recovery (Lay, et al, 1999; Nielsen, et al, 2001).
In the H2-generating process from organic wastes, H2, CO2, volatile fatty acids (VFA), and sometimes alcohols, are simultaneously produced (Yu, et al, 2002). Hydrogen fermentation by a mixed acidogenic population is a very complex process and is greatly influenced by many factors. These factors include temperature, pH, substrate concentration, carbon/nitrogen ratio, toxic substrates, etc. Previous studies have demonstrated that temperature, pH and substrate are important factors controlling biological H2 production (van Ginkel, et al, 2001; Zheng and Yu, 2004a, b). However, most of previous studies were conducted to evaluate effects of one or two factors on H2 fermentation. Since biological H2 production is influenced by two and more factors simultaneously, the conventional “change-one-factor-at-a-time” method is not appropriate for multifactor experiment design.
Response surface methodology (RSM) is collection of mathematical and statistical techniques useful for designing experiments, building models, evaluating relative significance of several independent variables, and determining optimum conditions for desirable responses (Draper and John, 1988; Yang, et al, 2003). The RSM has been used to optimize the wastewater treatment process such as anaerobic acidogenesis (Yang, et al, 2003). This study was conducted to explore the effect of temperature, pH and substrate concentration on H2 fermentation by using RSM, and try to find the optimum conditions for maximizing both H2 yield and H2 production rate.
Methods
A non-defined bacterial strain used for this study was isolated from anaerobic sludge, which originally came from a full-scale upflow anaerobic sludge blanket reactor treating citric acid-producing wastewater. A modified medium was used for H2-producing bacteria growth (Zheng and Yu, 2004a). Glucose was used as carbon source. A balanced nutrient was also dosed.
Hydrogen production experiments were conducted in a 5-liter fermentor (Baoxin Biotech Ltd., Shanghai). A 180 ml of culture, harvested at the exponential phase at 39oC and 150 rpm, was quickly transferred to the fermentor. The working volume of the fermentor was adjusted to 2.0 liters with distilled water. Prior to operation, the fermentor was purged with nitrogen for 10 min to ensure anaerobic conditions.
Temperature, pH and substrate concentration in the fermentor were changed according to the experimental design. The fermentor was stirred at a constant rate of 150 rpm to ensure a thorough mixing and to facilitate rapid diffusion of H2. The pH of the mixed liquor was controlled automatically by feeding NaOH (4M) and HCl (2M) solutions via respective peristaltic pumps. The amount of biogas produced was recorded using water-displacement method.
A full factorial central composite experiment design and RSM were applied (Yang, et al, 2003). The central values of experiment design were selected as temperature 40.0oC, pH 5.5 and glucose concentration 10.0 g/l. In developing the regression equation, the test variables were determined by the following equation.
xi=(Xi-Xi*)/ΔXi (1)
where xi is the coded value of the ith test variable, Xi is an uncoded value of the ith test variable, Xi* is an uncoded value of the ith test at the center point and ΔXi is the step change value.
A total of twenty runs were carried out to a full-factorial design for the three variables each at five levels and with five replicates of the central values. Table 1 shows experimental conditions and results of the central composite design for H2 yield.
The composition of biogas was analyzed by gas chromatograph as described previously (Zheng and Yu, 2004a). Glucose was measured by using anthrone-sulfuric acid method (Dubois, et al, 1956). Measurements of pH and VSS (volatile suspended solids) were performed according to the standard methods (APHA, 1995).
Results and discussion
Regression model
In order to study the effects of temperature, pH and substrate concentration on microbial H2 production, the second-order model polynomial regression model containing three linear, three quadratic, three interaction terms plus one block was employed. The functional form of this model is as follows:
Y=bo+b1X1+b2X2+b3X3+b11X12+b22X22+b33X32 +b12X1X2+b13X1X3+b23X2X3 (2)
where Y is responses; X1, X2 and X3 were temperature, pH and substrate concentration, respectively; b0, b1, b2, b3, b12, b13, b23, b11, b22, and b33 are the coefficients of Eq (2), which were estimated by using the function of “Microsoft Matlab 6.5” by converting the residual sum of squares between the experiment and the estimation to a minimum value.
Table 1 Experimental conditions and results of the central composite design for H2 yield
Run x1 x2 x3 X1 X2 X3 YH2 12
3
4
5
6
7
8
9
10
11
12
13
14
15
16
17
18
19
20 1
1
1
1
-1
-1
-1
-1
1.68
-1.68
0
0
0
0
0
0
0
0
0
0 1
1
-1
-1
1
1
-1
-1
0
0
1.68
-1.68
0
0
0
0
0
0
0
0 1
-1
1
-1
-1
1
1
-1
0
0
0
0
1.68
-1.68
0
0
0
0
0
0 47.5
47.5
47.5
47.5
32.5
32.5
32.5
32.5
52.6
27.4
40.0
40.0
40.0
40.0
40.0
40.0
40.0
40.0
40.0
40.0 6.3
6.3
4.8
4.8
6.3
6.3
4.8
4.8
5.5
5.5
6.8
4.8
5.5
5.5
5.5
5.5
5.5
5.5
5.5
5.5 12.5
7.5
12.5
7.5
7.5
12.5
12.5
7.5
10.0
10.0
10.0
10.0
14.2
5.8
10.0
10.0
10.0
10.0
10.0
10.0 0.75
0.89
0.44
0.79
0.97
1.07
0.42
0.47
0.31
1.17
1.00
0.11
1.76
1.78
1.69
1.78
1.72
1.61
1.66
1.73
X1: T(oC); X2: pH; X3: Glucose concentration (g/l); YH2: H2 yield (mol H2/mol-glucose)
Hydrogen yield
To evaluate the relationship of temperature (X1), pH (X2) and glucose concentration (X3) with H2 yield, the experimental data listed in Table 1 were subjected to regression analysis by Eq (2), generating the following equation:
YH2= -37.52+0.58X1+9.65X2+0.14X3+0.0001X1X2-0.0023X1X3+0.011X2X3
-0.0072X12-0.86X22-0.0065X32
(Degree of freedom=8; R2 = 0.912) (3)
From Eq (3), the optimum experimental conditions for maximum H2 yield can be estimated as temperature of 38.8oC, pH of 5.7 and glucose concentration of 8.8 g/l, respectively. The maximum H2 yield at theoptimum conditions was 1.79 mol H2/mol-glucose.
In Fig.1, the three-dimensional response surface figures are plotted. In each plot, one of the three factors was fixed at its optimum value; the other two factors were selected as two horizontal axes. Fig. 1A illustrates the effect of pH and substrate concentration on H2 yield. As shown in Fig. 1A, with the increase of pH from 4.5 to 5.8, H2 yield was increased rapidly. However, it decreased substantially when pH was further increase to 6.5. By contrast, H2 yield was only slightly influenced by the substrate concentration.
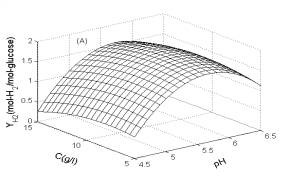
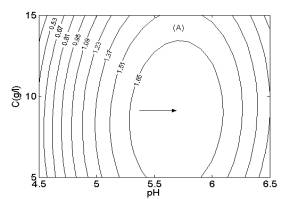
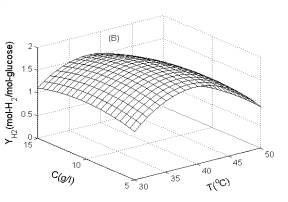
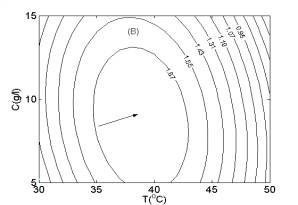
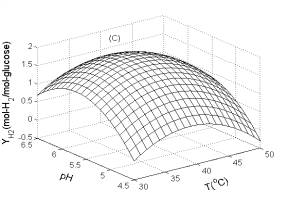
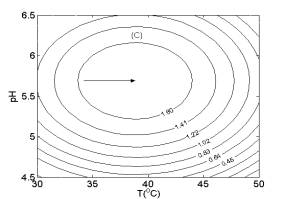 Fig. 1 Response surfaces analysis on H2 yield: (A) pH and substrate concentration; (B) temperature and substrate concentration; (C) temperature and pH Fig. 2 Two-dimensional contour plots on H2 yield: (A) pH and substrate concentration; (B) temperature and substrate concentration; (C) temperature and pH
 Fig. 1B shows the effects of temperature and substrate concentration on H2 yield. The H2 yield increased gradually when temperature was increased from 30.0 to 39.0oC. On the other hand, H2 yield was slightly affected by the substrate concentration. The optimum glucose concentration was 9.0 g/l.
Fig. 1C illustrates the influence of temperature and pH on H2 yield. The H2 yield was greatly influenced by pH, temperature and their interaction. The optimum pH and temperature were 6.0 and 40.0oC, respectively. Moreover, the H2 yield was affected more significantly by pH than temperature.
Two-dimensional contour plots (Fig. 2) were constructed using the quadratic models to estimate the optimum conditions for maximum H2 yield. Fig. 2A shows the effects of pH, concentration and their interaction on H2 yield. From Fig. 2A, the highest contour level of H2 yield was achieved at pH 5.7 and glucose concentration of 9.0 g/l.
Similarly, according to Fig. 2B and Fig. 2C, the highest contour levels of H2 yield were obtained at glucose concentration of 9.0 g/l, temperature of 39.0oC and pH 5.8, respectively.
Hydrogen production rate
The H2 production rate was also analyzed by using RSM. The relationship of temperature, pH and substrate concentration with H2 production rate (rm) was derived as follows:
rm= -20198+414X1+4470X2-37X3-5X12-413X22-4X32+X1X3+21X2X3
(Degree of freedom = 8; R2 = 0.887) (4)
From Eq (3), the optimum experimental conditions for maximum H2 production rate were estimated as temperature of 42.9oC, pH 5.8 and glucose concentration of 16.0 g/l, respectively. The maximum H2 production rate at the optimum condition was 1412 ml/h.
As illustrated in Fig. 3, H2 production rate was greatly influenced by temperature, pH and substrate concentration. The H2 production rate was affected most significantly by pH, but less significantly by temperature or substrate concentration. This implies that pH was the key factor for controlling H2 production.
In Fig. 4, two-dimensional contour plots were constructed using the quadratic models. As illustrated in Fig. 4A, the highest contour level of H2 production rate was achieved at pH 5.8, glucose concentration of 16.0 g/l. According to Fig. 4B and Fig. 4C, the highest contour levels of H2 production rate were located at glucose concentration of 16.0 g/l, temperature of 43.0oC, and temperature of 43.0oC, pH 5.8, respectively. The above results were also in good agreement with those estimated by mathematical methods.
Confirmation experiments
To confirm the validity of the optimum experiments condition obtained by RSM, two additional experiments were conducted at temperature of 38.8oC, pH 5.7, glucose concentration of 8.8 g/l, and temperature of 42.9oC, pH 5.8, glucose concentration of 16.0 g/l, respectively. The measured results for H2 yield and H2 production rate are listed in Table 2.
The maximum H2 yield obtained in the conformation experiment at temperature 38.8oC, pH 5.7 and glucose concentration 8.8 g/l was 1.77 mol H2/mol-glucose, close to 1.79 mol H2/mol-glucose calculated by regression analysis. On the other hand, the measured maximum H2 production rate in the conformation experiment at temperature of 42.9oC, pH 5.8 and glucose concentration of 16.0 g/l was 1208 ml/h, was also close to 1412 ml/h estimated by regression analysis. The above results demonstrate that the full factorial central experimental design and RSM were appropriate and useful for optimizing biological H2 production by mixed anaerobic cultures.
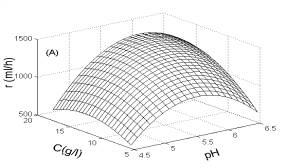
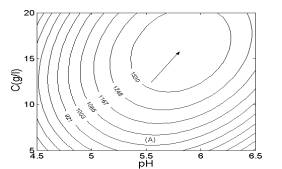
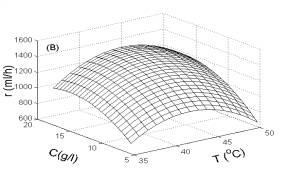
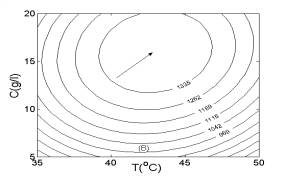
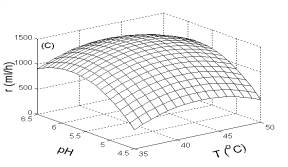
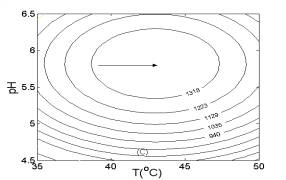 Fig. 3 Response surfaces analysis on H2 production rate: (A) pH and substrate concentration; (B) temperature and substrate concentration; (C) temperature and pH Fig. 4 Two-dimensional contour plots on H2 production rate: (A) pH and substrate concentration; (B) temperature and substrate concentration; (C) temperature and pH
 Table 2 Results of confirmation experiments
T(oC) pH Glucose concentration
(g/l) YH2
(mol H2/mol-glucose) 38.8
42.9 5.7
5.8 8.8
16.0 1.77 ± 0.03
1.15 ±0.05
Data were given as mean value±SD, n=3
Conclusions
Response surface methodology, including experimental design, model building and regression analysis, was successfully applied to determine the optimum conditions for H2 yield and H2 production rate. The optimum conditions were at temperature of 38.8oC, pH 5.7 and glucose concentration of 8.8 g/l for H2 yield with a maximum value of 1.79 mol H2/mol-glucose. The maximum H2 production rate was estimated as 1412 ml/h under the optimum conditions of temperature 42.9oC, pH 5.8 and glucose concentration 16.0 g/l. Furthermore, the measured results in the confirmation experiments were in good agreement with those estimated by RSM.
Acknowledgements
The authors wish to thank the Natural Science Foundation of China (Grant No. 20122203) for the partial financial support of this study.
References
APHA, AWWA, WEF. Standard Methods for the Examination of Water and Wastewater (1995). 19th edn, American Public Health Association, Washington DC, USA.
Draper N. and John J. A. (1988). Response-surface designs for quantitative and qualitative variables. Technometrics, 30(4), 423-428.
Dubois M., Gilles K. A., Hamilton J. K., Rebers P. A. and Smith F. (1956). Colorimetric method for determination sugars and related substance. Anal. Chem., 28, 350-356.
Lay J. J., Lee Y. J. and Noike T. (1999). Feasibility of biological hydrogen production from organic fraction of municipal solid waste. Wat. Res., 33(11), 2579-2586.
Nielsen A. T., Amandusson H., Bjorklund R., Dannetun H., Ejlertsson J., Ekedahl L. G., Lundstrom I. and Sevensson B. H. (2001). Hydrogen production from organic waste. Int. J. Hydrogen Energy, 26, 547-550.
van Ginkel S., Sung S. and Lay J. J. (2001). Biohydrogen production as a function of pH and substrate concentration. Environ. Sci. Technol., 35, 4726-4730.
Yang K., Yu Y. and Hwang S. (2003). Selective optimization in thermophilic acidogenesis of cheese-whey wastewater to acetate and butyrate acids: partial acidification and methanation. Wat. Res., 37, 2467-2477.
Yu H. Q, Zhu Z. H., Hu W. R. and Zhang H. S. (2002). Hydrogen production from rice winery wastewater in an upflow anaerobic reactor by using mixed anaerobic culture. Int. J. Hydrogen Energy, 27, 1359-1365.
Zheng X. J. and Yu H. Q. (2004a). Biological hydrogen production by enriched anaerobic culture in the presence of copper and zinc. J. Environ. Sci. Health. Part A, 39(1), 89-101.
Zheng X. J. and Yu H. Q. (2004b). The roles of pH in biologic production of hydrogen and volatile fatty acids from glucose by enriched anaerobic cultures. Appl. Biochem. Biotech., 112(2), 79-90.
论文搜索
月热点论文
论文投稿
很多时候您的文章总是无缘变成铅字。研究做到关键时,试验有了起色时,是不是想和同行探讨一下,工作中有了心得,您是不是很想与人分享,那么不要只是默默工作了,写下来吧!投稿时,请以附件形式发至 [email protected] ,请注明论文投稿。一旦采用,我们会为您增加100枚金币。